
Why don’t I see PMUFW XPfw_Printfs: A Debug Story
![]()
This post list my debug of why I don’t see XPfw_Print() output from PMUFW included in PetaLinux Tools 2017.4.
TL;DR
There’s no UART output because the PS UART is not on when I load PMUFW.
Related
Symptom
I don’t see this print from XPfw_Main():
XStatus XPfw_Main(void)
{
        XStatus Status;

        /* Start the Init Routine */
        XPfw_Printf(DEBUG_PRINT_ALWAYS,"PMU Firmware %s\t%s   %s\r\n",
                        ZYNQMP_XPFW_VERSION, __DATE__, __TIME__);
File:
$PETALINUX_PROJS_DIR/$PETALINUX_PROJ_NAME/components/plnx_workspace/pmufw/pmu-firmware/src/xpfw_main.c
Hypothesis 1
I don’t see XPfw_Printf because there’s a missing DEBUG define
Info
Where is XPfw_Printf?
Grep:
components/plnx_workspace/pmufw/pmu-firmware/src$ grep XPfw_Printf *
Output:
xpfw_core.c:	XPfw_Printf(DEBUG_DETAILED,"Scheduler State: %s\r\n",
xpfw_core.c:	XPfw_Printf(DEBUG_DETAILED,"Scheduler Ticks: %lu\r\n",
xpfw_core.c:	XPfw_Printf(DEBUG_DETAILED,
xpfw_debug.h:#define XPfw_Printf(DebugType,...)\
xpfw_error_manager.c:			XPfw_Printf(DEBUG_DETAILED,"Warning: XPfw_EmInit: Failed to "
xpfw_interrupts.c:	XPfw_Printf(DEBUG_ERROR,"Error: NullHandler Triggered!\r\n");
xpfw_interrupts.c:	XPfw_Printf(DEBUG_DETAILED,"PMU RAM Correctable ECC occurred!\r\n");
xpfw_interrupts.c:		XPfw_Printf(DEBUG_DETAILED,"Warning: Failed to dispatch Event ID:"
Relevant Lines in xpfw_debug.h:
/**
 * Debug levels for PMUFW
 */
#define DEBUG_PRINT_ALWAYS (0x00000001U) /* Unconditional messages */
#define DEBUG_ERROR (0x00000002U) /* Error messages */
#define DEBUG_DETAILED (0x00000004U) /* More debug information */

#if defined(XPFW_DEBUG_DETAILED)
#define XPfwDbgCurrentTypes ((DEBUG_DETAILED) | (DEBUG_ERROR) |\
                (DEBUG_PRINT_ALWAYS))
#elif defined(XPFW_DEBUG_ERROR)
#define XPfwDbgCurrentTypes ((DEBUG_ERROR) | (DEBUG_PRINT_ALWAYS))
#elif defined(XPFW_PRINT)
#define XPfwDbgCurrentTypes (DEBUG_PRINT_ALWAYS)
#else
#define XPfwDbgCurrentTypes (0U)
#endif

#define XPfw_Printf(DebugType,...)\
        if(((DebugType) & XPfwDbgCurrentTypes) != (u8)XST_SUCCESS){xil_printf(__VA_ARGS__);}
Test Hypothesis 1
Are XPFW_DEBUG_DETAILED, XPFW_DEBUG_ERROR and XPFW_PRINT?
Method
Use #error’s in the code and recompile. See link for how to recompile PMUFW.
/**
 * Debug levels for PMUFW
 */
#define DEBUG_PRINT_ALWAYS (0x00000001U) /* Unconditional messages */
#define DEBUG_ERROR (0x00000002U) /* Error messages */
#define DEBUG_DETAILED (0x00000004U) /* More debug information */

#if defined(XPFW_DEBUG_DETAILED)
#error "DEBUG: XPFW_DEBUG_DETAILED defined"
#define XPfwDbgCurrentTypes ((DEBUG_DETAILED) | (DEBUG_ERROR) |\
                (DEBUG_PRINT_ALWAYS))
#elif defined(XPFW_DEBUG_ERROR)
#error "DEBUG: XPFW_DEBUG_ERROR defined"
#define XPfwDbgCurrentTypes ((DEBUG_ERROR) | (DEBUG_PRINT_ALWAYS))
#elif defined(XPFW_PRINT)
#error "DEBUG: XPFW_PRINT defined"
#define XPfwDbgCurrentTypes (DEBUG_PRINT_ALWAYS)
#else
#error "DEBUG: No debug print define"
#define XPfwDbgCurrentTypes (0U)
#endif

#define XPfw_Printf(DebugType,...)\
        if(((DebugType) & XPfwDbgCurrentTypes) != (u8)XST_SUCCESS){xil_printf(__VA_ARGS__);}
Compile
bitbake pmu-firmware -c compile -C compile
Compile Output
| Building '/pmu-firmware'
| 00:15:41 **** Build of configuration Release for project pmu-firmware ****
| ERROR: pmu-firmware compile failed.
| make all
| Building file: ../src/idle_hooks.c
| Invoking: MicroBlaze gcc compiler
| mb-gcc -Wall -O2 -c -fmessage-length=0 -MT"src/idle_hooks.o" -Os -flto -ffat-lto-objects -I../../pmu-firmware_bsp/psu_pmu_0/include -mlittle-endian -mxl-barrel-shift -mxl-pattern-compare -mcpu=v9.2 -mxl-soft-mul -Wl,--no-relax -ffunction-sections -fdata-sections -MMD -MP -MF"src/idle_hooks.d" -MT"src/idle_hooks.o" -o "src/idle_hooks.o" "../src/idle_hooks.c"
| In file included from ../src/xpfw_default.h:41:0,
|                  from ../src/pm_common.h:40,
|                  from ../src/idle_hooks.c:37:
| ../src/xpfw_debug.h:82:2: error: #error "DEBUG: XPFW_PRINT defined"
|  #error "DEBUG: XPFW_PRINT defined"
|   ^~~~~
| make: *** [src/subdir.mk:183: src/idle_hooks.o] Error 1
|
| 00:15:42 Build Finished (took 1s.494ms)
|
| Invoking scanner config builder on project
| WARNING: /home/pfefferz/plprj4/mtd_board/build/tmp/work/plnx_aarch64-xilinx-linux/pmu-firmware/2017.4+gitAUTOINC+77448ae629-r0/temp/run.do_compile.13665:1 exit 1 from 'exit 1'
| ERROR: Function failed: do_compile (log file is located at /home/pfefferz/plprj4/mtd_board/build/tmp/work/plnx_aarch64-xilinx-linux/pmu-firmware/2017.4+gitAUTOINC+77448ae629-r0/temp/log.do_compile.13665)
ERROR: Task (/home/pfefferz/tools/opt/pkg/petalinux/components/yocto/source/aarch64/layers/meta-xilinx-tools/recipes-bsp/pmu/pmu-firmware_git.bb:do_compile) failed with exit code '1'
NOTE: Tasks Summary: Attempted 317 tasks of which 316 didn't need to be rerun and 1 failed.

Summary: 1 task failed:
  /home/pfefferz/tools/opt/pkg/petalinux/components/yocto/source/aarch64/layers/meta-xilinx-tools/recipes-bsp/pmu/pmu-firmware_git.bb:do_compile
Summary: There were 2 WARNING messages shown.
Summary: There were 2 ERROR messages shown, returning a non-zero exit code.
Who defines XPFW_PRINT?
Its not defined on the command line, no -DXPFW_PRINT
Grep
grep XPFW_PRINT *
Output
pfefferz@plc2:~/plprj4/mtd_board/components/plnx_workspace/pmufw/pmu-firmware/src$ grep XPFW_PRINT *
xpfw_config.h:#define XPFW_PRINT_VAL (1U)
xpfw_config.h:#if XPFW_PRINT_VAL
xpfw_config.h:#define XPFW_PRINT
xpfw_debug.h:#elif defined(XPFW_PRINT)
xpfw_debug.h:/* #error "DEBUG: XPFW_PRINT defined" */
Defined in xpfw_config.h
/* PMUFW print levels */
#define XPFW_PRINT_VAL (1U)
#define XPFW_DEBUG_ERROR_VAL (0U)
#define XPFW_DEBUG_DETAILED_VAL (0U)
Which is included in xpfw_default.h as seen here
Grep
grep xpfw_config.h *
Output
xpfw_default.h:#include "xpfw_config.h"
…which was referenced in the debug output.
Hypothesis 1 Conclusion
Hypothesis 1 is not true. There is a define that should allow me to see DEBUG_PRINT_ALWAYS.
Hypothesis 2
I never get to the print.
Method
Use an infinite loop before the print and break in with xsct over JTAG.
Change:
int SPIN = 1;

XStatus XPfw_Main(void)
{
        XStatus Status;

        while(SPIN);

        /* Start the Init Routine */
Recompile
bitbake pmu-firmware -c compile -C compile
pfefferz@plc2:~/plprj4/mtd_board/build$ find $PETALINUX -name "readelf"
/home/pfefferz/tools/opt/pkg/petalinux/tools/linux-i386/microblaze-xilinx-elf/microblaze-xilinx-elf/bin/readelf
Add the path to it to PATH in a local window:
export PATH=/home/pfefferz/tools/opt/pkg/petalinux/tools/linux-i386/microblaze-xilinx-elf/microblaze-xilinx-elf/bin:$PATH
Check it:
pfefferz@plc2:~/build$ which readelf
/home/pfefferz/tools/opt/pkg/petalinux/tools/linux-i386/microblaze-xilinx-elf/microblaze-xilinx-elf/bin/readelf
Run it, look at xsct output
pfefferz@plc2:~/build$ objdump -SD /home/pfefferz/plprj4/mtd_board/components/plnx_workspace/pmufw/pmu-firmware/Release/pmu-firmware.elf | grep -A20 XPfw_Main
ffdc723c <XPfw_Main>:
ffdc723c:	b8000000 	bri	0		// ffdc723c

ffdc7240 <XPfw_IpiTrigger>:
ffdc7240:	10c50000 	addk	r6, r5, r0
ffdc7244:	b000ffdd 	imm	-35
ffdc7248:	30a02e28 	addik	r5, r0, 11816
Find XPfw_Main
In xsct
Run targets
targets
xsct%   1  PS TAP
     2  PMU
        3  MicroBlaze PMU (External debug request)
     4  PL
  5* PSU
     6  RPU (Reset)
        7  Cortex-R5 #0 (RPU Reset)
        8  Cortex-R5 #1 (RPU Reset)
     9  APU (L2 Cache Reset)
       10  Cortex-A53 #0 (APU Reset)
       11  Cortex-A53 #1 (APU Reset)
       12  Cortex-A53 #2 (APU Reset)
       13  Cortex-A53 #3 (APU Reset)
Read the registers
xsct% rrd
 r0: 00000000   r1: ffdd3f58   r2: ffdd0a20   r3: fffffff8   r4: 00000000
 r5: 00000003   r6: ffdd2f54   r7: ffdd2f54   r8: 00000010   r9: 00000000
r10: 00000000  r11: ffdd2f54  r12: 00000000  r13: ffdd0a20  r14: ffd02f24
r15: ffdc87a0  r16: 00000000  r17: 00000000  r18: 00000000  r19: 00000000
r20: 00000000  r21: 00000000  r22: 00000000  r23: 00000000  r24: 00000000
r25: 00000000  r26: 00000000  r27: 00000000  r28: 00000000  r29: 00000000
r30: 00000000  r31: 00000000   pc: ffdc723c  msr: 00000106  ear: 00000000
esr: 00000000  btr: ffdc723c  slr: ffdd2f54  shr: ffdd3f58  dcr: 00000009
dsr: 01010000
The PC matches the bri line from above. So that shows we can get to this line of code.
Do I get into the print, does the print do anything?
Look for any XPfw_Printf’s
pfefferz@plc2:~/build$ objdump -SD /home/pfefferz/plprj4/mtd_board/components/plnx_workspace/pmufw/pmu-firmware/Release/pmu-firmware.elf | grep -A20 XPfw_Printf
Empty! Weird.
If I remove the spin loop, will the XPfw_Printf’s still be present?
Yes:
pfefferz@plc2:~/build$ objdump -D /home/pfefferz/plprj4/mtd_board/components/plnx_workspace/pmufw/pmu-firmware/Release/pmu-firmware.elf | grep -A20 XPfw_Main
ffdc723c <XPfw_Main>:
ffdc723c:	b000ffdc 	imm	-36
ffdc7240:	3100cb7c 	addik	r8, r0, -13444
ffdc7244:	b000ffdc 	imm	-36
ffdc7248:	30e0cb88 	addik	r7, r0, -13432
ffdc724c:	b000ffdc 	imm	-36
ffdc7250:	30c0cb94 	addik	r6, r0, -13420
ffdc7254:	b000ffdc 	imm	-36
ffdc7258:	30a0cb9c 	addik	r5, r0, -13412
ffdc725c:	3021ffd8 	addik	r1, r1, -40
ffdc7260:	f9e10000 	swi	r15, r1, 0
ffdc7264:	fa61001c 	swi	r19, r1, 28
ffdc7268:	fac10020 	swi	r22, r1, 32
ffdc726c:	b0000000 	imm	0
ffdc7270:	b9f42a84 	brlid	r15, 10884	// ffdc9cf4 <xil_printf>
Start stepping into prints
Set a breakpoint on 0xffdc7270
To set the breakpoint:
Enumerate targets
targets
xsct%   1  PS TAP
     2  PMU
        3  MicroBlaze PMU (External debug request)
     4  PL
  5* PSU
     6  RPU (Reset)
        7  Cortex-R5 #0 (RPU Reset)
        8  Cortex-R5 #1 (RPU Reset)
     9  APU (L2 Cache Reset)
       10  Cortex-A53 #0 (APU Reset)
       11  Cortex-A53 #1 (APU Reset)
       12  Cortex-A53 #2 (APU Reset)
       13  Cortex-A53 #3 (APU Reset)
Select the PMU and dump registers
xsct% targets 3
xsct% rrd
 r0: 00000000   r1: ffdd3f58   r2: ffdd0a20   r3: fffffff8   r4: 00000000
 r5: 00000003   r6: ffdd2f54   r7: ffdd2f54   r8: 00000010   r9: 00000000
r10: 00000000  r11: ffdd2f54  r12: 00000000  r13: ffdd0a20  r14: ffd02f24
r15: ffdc87a0  r16: 00000000  r17: 00000000  r18: 00000000  r19: 00000000
r20: 00000000  r21: 00000000  r22: 00000000  r23: 00000000  r24: 00000000
r25: 00000000  r26: 00000000  r27: 00000000  r28: 00000000  r29: 00000000
r30: 00000000  r31: 00000000   pc: ffdc723c  msr: 00000106  ear: 00000000
esr: 00000000  btr: ffdc723c  slr: ffdd2f54  shr: ffdd3f58  dcr: 00000009
dsr: 01010000
Set the breakpoint
xsct% bpadd -addr 0xffdc7270 -type hw
0
xsct% Info: Breakpoint 0 status:
   target 3: {All hardware breakpoints are allocated}
Hmm… can’t set a hardware breakpoint, set a software breakpoint instead:
xsct% bpadd -addr 0xffdc7270 -type sw
1
xsct% Info: Breakpoint 1 status:
   target 3: {Address: 0xffdc7270 Type: Software}
Reset unit via external power suppy
outp 0
outp 1
Continue setting breakpoints until the the UART FIFO gets written
See the breakpoint on 0xffdc7270, the call to xil_printf, get hit
xsct% Info: MicroBlaze PMU (target 3) Stopped at 0xffdc7270 (Breakpoint)
xsct% bpstatus
wrong # args: should be "bpstatus id"
xsct% bpstatus 0
target 3: HitCount 0 Address 0xffdc7270 Size 1 Error {All hardware breakpoints are allocated}

xsct% bpstatus 1
target 3: HitCount 1 Address 0xffdc7270 Size 1 BreakpointType Software
Step one instruction
xsct% stpi
Info: MicroBlaze PMU (target 3) Stopped at 0xffdc9cf4 (Step)
xsct% dis
ffdc9cf4: addk          r3 , r5 , r0
Look at the backtrace
xsct% bt
    0  0xffdc9cf4
    1  0xffdc7278
    2  0xffdc8b20
Step one instruction and disassemble
xsct% stpi
Info: MicroBlaze PMU (target 3) Stopped at 0xffdc9cf8 (Step)
xsct% dis
ffdc9cf8: swi           r5 , r1 , 4
Correlate addresses with instructions
pfefferz@plc2:~/build$ objdump -D /home/pfefferz/plprj4/mtd_board/components/plnx_workspace/pmufw/pmu-firmware/Release/pmu-firmware.elf | grep -A40 \<xil_printf\>:
...
ffdc9cf4 <xil_printf>:
ffdc9cf4:	10650000 	addk	r3, r5, r0
ffdc9cf8:	f8a10004 	swi	r5, r1, 4
ffdc9cfc:	f8c10008 	swi	r6, r1, 8
ffdc9d00:	f8e1000c 	swi	r7, r1, 12
ffdc9d04:	f9010010 	swi	r8, r1, 16
ffdc9d08:	f9210014 	swi	r9, r1, 20
ffdc9d0c:	f9410018 	swi	r10, r1, 24
ffdc9d10:	3021ffb4 	addik	r1, r1, -76
ffdc9d14:	fac10040 	swi	r22, r1, 64
ffdc9d18:	f9e10000 	swi	r15, r1, 0
ffdc9d1c:	fa61003c 	swi	r19, r1, 60
ffdc9d20:	fae10044 	swi	r23, r1, 68
ffdc9d24:	fb010048 	swi	r24, r1, 72
ffdc9d28:	32c10054 	addik	r22, r1, 84
ffdc9d2c:	f8a10038 	swi	r5, r1, 56
ffdc9d30:	be030040 	beqid	r3, 64		// ffdc9d70
ffdc9d34:	e9e10000 	lwi	r15, r1, 0
ffdc9d38:	e0a30000 	lbui	r5, r3, 0
ffdc9d3c:	90a50060 	sext8	r5, r5
ffdc9d40:	be05002c 	beqid	r5, 44		// ffdc9d6c
ffdc9d44:	aa650025 	xori	r19, r5, 37
ffdc9d48:	be130040 	beqid	r19, 64		// ffdc9d88
ffdc9d4c:	30800020 	addik	r4, r0, 32
ffdc9d50:	b0000000 	imm	0
ffdc9d54:	b9f40350 	brlid	r15, 848	// ffdca0a4 <outbyte>
Set a breakpoint on outbyte, continued, dissemble, look at the backtrace
xsct% bpadd -addr 0xffdca0a4 -type sw
2
xsct% Info: Breakpoint 2 status:
   target 3: {Address: 0xffdca0a4 Type: Software}
xsct% con
xsct% Info: MicroBlaze PMU (target 3) Stopped at 0xffdca0a4 (Breakpoint)
xsct% bplist
ID        Enabled   Location            Status
==        =======   ========            ======
0         1         0xffdc7270          target 3: {Error {All hardware breakp
                                        oints are allocated}}
1         1         0xffdc7270          target 3: {Address 0xffdc7270 HitCoun
                                        t 1}
2         1         0xffdca0a4          target 3: {Address 0xffdca0a4 HitCoun
                                        t 1}
xsct% dis
ffdca0a4: andi          r6 , r5 , 255

xsct% bt
    0  0xffdca0a4
    1  0xffdc9d5c
    2  0xffdc7278
    3  0xffdc8b20
xsct% stpi
Info: MicroBlaze PMU (target 3) Stopped at 0xffdca0a8 (Step)
xsct% dis
ffdca0a8: imm           -256
Correlate addresses with instructions
pfefferz@plc2:~/build$ objdump -D /home/pfefferz/plprj4/mtd_board/components/plnx_workspace/pmufw/pmu-firmware/Release/pmu-firmware.elf | grep -A40 \<outbyte\>:
ffdca0a4 <outbyte>:
ffdca0a4:	a4c500ff 	andi	r6, r5, 255
ffdca0a8:	b000ff00 	imm	-256
ffdca0ac:	30a00000 	addik	r5, r0, 0
ffdca0b0:	3021fffc 	addik	r1, r1, -4
ffdca0b4:	f9e10000 	swi	r15, r1, 0
ffdca0b8:	b000ffff 	imm	-1
ffdca0bc:	b9f4ffcc 	brlid	r15, -52	// ffdca088 <XUartPs_SendByte>
ffdca0c0:	80000000 	or	r0, r0, r0
ffdca0c4:	e9e10000 	lwi	r15, r1, 0
ffdca0c8:	b60f0008 	rtsd	r15, 8
ffdca0cc:	30210004 	addik	r1, r1, 4
Get the address
pfefferz@plc2:~/build$ objdump -D /home/pfefferz/plprj4/mtd_board/components/plnx_workspace/pmufw/pmu-firmware/Release/pmu-firmware.elf | grep -A40 \<XUartPs_SendByte\>:
ffdca088 <XUartPs_SendByte>:
ffdca088:	3085002c 	addik	r4, r5, 44
ffdca08c:	e8640000 	lwi	r3, r4, 0
ffdca090:	a4630010 	andi	r3, r3, 16
ffdca094:	bc23fff8 	bnei	r3, -8		// ffdca08c
ffdca098:	f8c50030 	swi	r6, r5, 48
ffdca09c:	b60f0008 	rtsd	r15, 8
ffdca0a0:	80000000 	or	r0, r0, r0
xsct% bpadd -addr 0xffdca088 -type sw
3
xsct% Info: Breakpoint 3 status:
   target 3: {Address: 0xffdca088 Type: Software}
xsct% con
xsct% Info: MicroBlaze PMU (target 3) Stopped at 0xffdca088 (Breakpoint)
xsct% dis
ffdca088: addik         r4 , r5 , 44

xsct% bt
    0  0xffdca088
    1  0xffdca0c4
    2  0xffdc9d5c
    3  0xffdc7278
    4  0xffdc8b20
xsct% stpi
Info: MicroBlaze PMU (target 3) Stopped at 0xffdca08c (Step)
xsct% dis
ffdca08c: lwi           r3 , r4 , 0

xsct% stpi
Info: MicroBlaze PMU (target 3) Stopped at 0xffdca090 (Step)
xsct% rrd
 r0: 00000000   r1: ffdd4580   r2: ffdd10c0   r3: 00000000   r4: ff00002c
 r5: ff000000   r6: 00000050   r7: ffdccb88   r8: ffdccb7c   r9: 00000000
r10: 00000000  r11: ffdd35f4  r12: 00000000  r13: ffdd10c0  r14: ffd02f24
r15: ffdca0bc  r16: 00000000  r17: 00000000  r18: 00000000  r19: 00000075
r20: 00000000  r21: 00000000  r22: ffdd45d8  r23: 00000000  r24: 00000000
r25: 00000000  r26: 00000000  r27: 00000000  r28: 00000000  r29: 00000000
r30: 00000000  r31: 00000000   pc: ffdca090  msr: 00000106  ear: 00000000
esr: 00000000  btr: ffdca088  slr: ffdd35f4  shr: ffdd45f8  dcr: 00000009
dsr: 01010000
Set a breakpoint on the instruction that actually writes to the UART hardware ands continue until you get to that line
xsct% bpadd -addr 0xffdca094 -type sw
4
xsct% Info: Breakpoint 4 status:
   target 3: {Address: 0xffdca094 Type: Software}
xsct% con
xsct% Info: MicroBlaze PMU (target 3) Stopped at 0xffdca094 (Breakpoint)
xsct% dis
ffdca094: bnei          r3 , -8           ; addr=0xffdca08c

xsct% rrd
 r0: 00000000   r1: ffdd4580   r2: ffdd10c0   r3: 00000000   r4: ff00002c
 r5: ff000000   r6: 00000050   r7: ffdccb88   r8: ffdccb7c   r9: 00000000
r10: 00000000  r11: ffdd35f4  r12: 00000000  r13: ffdd10c0  r14: ffd02f24
r15: ffdca0bc  r16: 00000000  r17: 00000000  r18: 00000000  r19: 00000075
r20: 00000000  r21: 00000000  r22: ffdd45d8  r23: 00000000  r24: 00000000
r25: 00000000  r26: 00000000  r27: 00000000  r28: 00000000  r29: 00000000
r30: 00000000  r31: 00000000   pc: ffdca094  msr: 00000106  ear: 00000000
esr: 00000000  btr: ffdca088  slr: ffdd35f4  shr: ffdd45f8  dcr: 00000009
dsr: 01810000

xsct% stpi
Info: MicroBlaze PMU (target 3) Stopped at 0xffdca098 (Step)
xsct% rrd
 r0: 00000000   r1: ffdd4580   r2: ffdd10c0   r3: 00000000   r4: ff00002c
 r5: ff000000   r6: 00000050   r7: ffdccb88   r8: ffdccb7c   r9: 00000000
r10: 00000000  r11: ffdd35f4  r12: 00000000  r13: ffdd10c0  r14: ffd02f24
r15: ffdca0bc  r16: 00000000  r17: 00000000  r18: 00000000  r19: 00000075
r20: 00000000  r21: 00000000  r22: ffdd45d8  r23: 00000000  r24: 00000000
r25: 00000000  r26: 00000000  r27: 00000000  r28: 00000000  r29: 00000000
r30: 00000000  r31: 00000000   pc: ffdca098  msr: 00000106  ear: 00000000
esr: 00000000  btr: ffdca088  slr: ffdd35f4  shr: ffdd45f8  dcr: 00000009
dsr: 01010000

xsct% dis
ffdca098: swi           r6 , r5 , 48
Decode swi r6, r5, 48 with the Registers
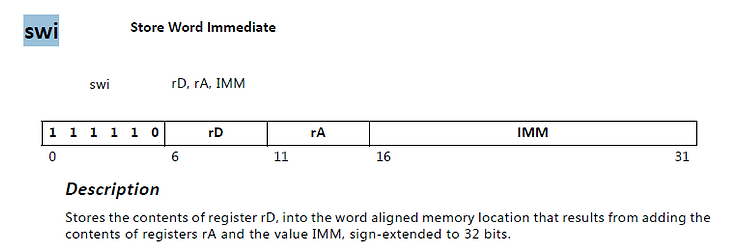
r6 (rD) is 0x50
r5 (rA) is 0xff000000
IMM is 48 or 0x30
Replacing text: Store 0x50 (Ascii ‘P’) to 0xff000030
The P comes from “PMU Firm…”:
XStatus XPfw_Main(void)
{
        XStatus Status;

        /* Start the Init Routine */
        XPfw_Printf(DEBUG_PRINT_ALWAYS,"PMU Firmware %s\t%s   %s\r\n",
                        ZYNQMP_XPFW_VERSION, __DATE__, __TIME__);
0xff000030 is the TX FIFO of UART 0
Try reading and writing to of ff000030 from xsct
xsct% mrd 0xff000000
Memory read error at 0xFF000000. Invalid address
xsct% mwr 0xff000030 0x50
Memory write error at 0xFF000030. Invalid address
Bingo!
There is no output because the UART is not on at this point! I’m loading the PMUFW first with:
connect -url tcp:localhost:3121

targets -set -nocase -filter {name =~ "*PSU*"}
stop
rst -system
after 2000

targets -set -nocase -filter {name =~ "*PMU*"}
stop
rst -system
after 2000

targets -set -nocase -filter {name =~ "*PSU*"}
stop
rst -system
after 2000

mwr 0xFFCA0038 0x1ff

targets -set -nocase -filter {name =~ "*MicroBlaze PMU*"}
dow /home/pfefferz/build/out/pmufw.elf
after 2000
con
And the other systems are reporting:
xsct% targets
  1  PS TAP
     2  PMU
        3* MicroBlaze PMU (Step)
     4  PL
  5  PSU
     6  RPU (Reset)
        7  Cortex-R5 #0 (RPU Reset)
        8  Cortex-R5 #1 (RPU Reset)
     9  APU (L2 Cache Reset)
       10  Cortex-A53 #0 (APU Reset)
       11  Cortex-A53 #1 (APU Reset)
       12  Cortex-A53 #2 (APU Reset)
       13  Cortex-A53 #3 (APU Reset)
So I either need to wait longer to see these prints, print them to UART1 or figure out something else.
References